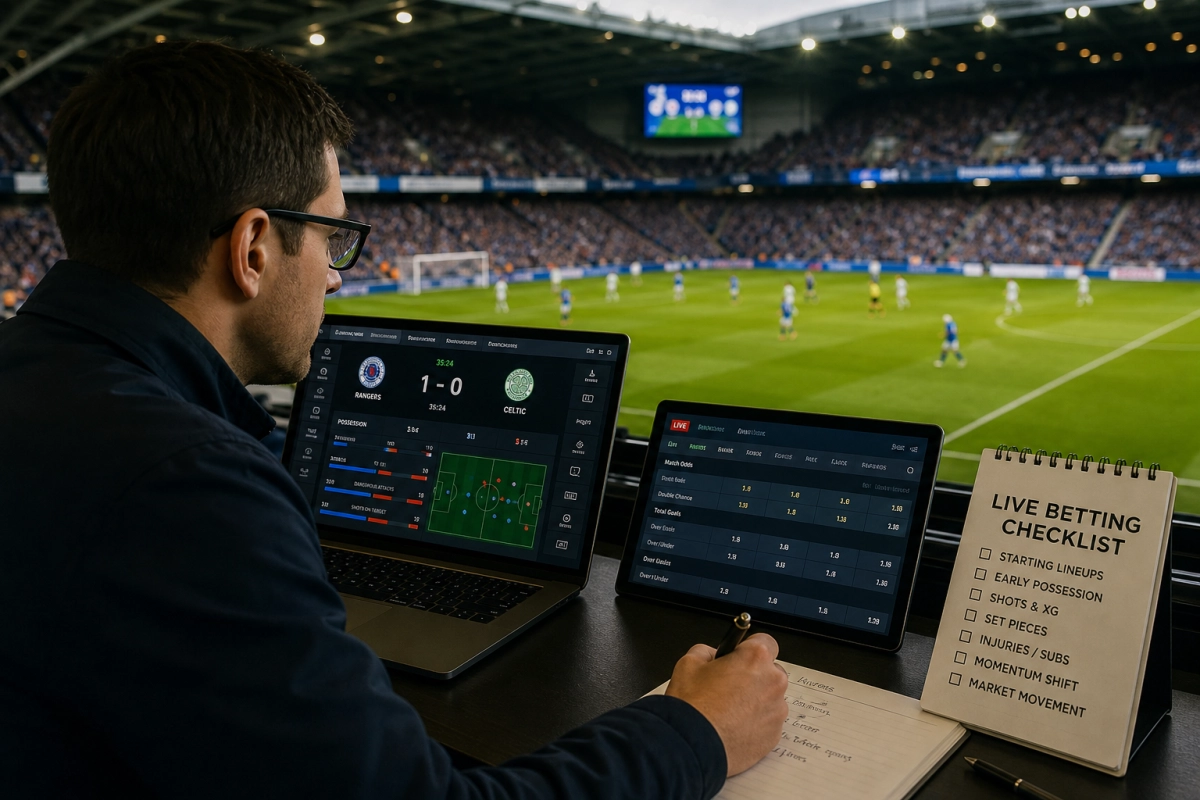

How to Evaluate Live Football Matches with More Than One Statistic
Live betting can offer useful information because a match is developing in real time, but one statistic rarely explains the complete picture. Possession may show which team has the ball, while shots on target, dangerous attacks, field position and big chances provide more detail about whether that control is creating genuine pressure.
This guide explains how football followers can combine these indicators before considering markets such as match result, total goals or both teams to score (BTTS). The aim is not to produce a guaranteed prediction, but to create a disciplined process for interpreting the match and comparing the available odds.
Start with the Match Context and Live Data
Before reading the statistics, the observer should understand the pre-match situation. Recent form, home and away records, expected line-ups, injuries, suspensions, tactical styles and fixture congestion can influence how the live numbers should be interpreted. A team playing away against a stronger opponent may deliberately allow possession and defend in a compact shape.
Live match panels commonly display possession, total attacks, dangerous attacks, shots, shots on target, corners and cards. These figures should be viewed alongside the scoreline and the time played. For example, a team leading early may reduce its attacking risk, while a team trailing may record more possession without creating clear opportunities.
A simple first review can ask:
- Which team is controlling the territory, not only the ball?
- Are attacks reaching the final third or ending in harmless passing?
- Are shots being taken from dangerous positions?
- Has the scoreline changed the teams’ approach?
- Have substitutions or injuries altered the balance?
Why Possession Needs Support from Other Measures
Possession is the percentage of time each team has the ball. It can indicate control, but it does not automatically mean that a team is close to scoring. A side may hold possession in its own half or circulate the ball across the defence while the opponent protects the central areas.
Field position helps separate useful possession from sterile possession. Frequent entries into the attacking third, pressure around the penalty area and repeated attacks down the wings may show more meaningful territorial control. Dangerous attacks can support this interpretation, although definitions may differ between data providers, so the figures should not be treated as perfectly precise.
Shots and shots on target add another layer. Total shots show attacking intent, while shots on target indicate that attempts have tested the goalkeeper or reached the target. However, shot quality still matters. Several long-range efforts may be less concerning than one close-range opportunity.
Big chances deserve particular attention because they represent high-quality scoring opportunities. When possession, territory, shots on target and big chances point in the same direction, the pressure is more credible. When they disagree, the match requires caution rather than an immediate betting decision.
The next step is to connect these statistics with tactical changes and the specific live betting market being considered.
Read Tactical Changes Through the Live Numbers
Statistics become more useful when they are compared before and after a tactical change. A substitution may add pace on the wing, provide an extra forward or strengthen the midfield, but its effect should be assessed through the match pattern rather than the player’s reputation alone.
For example, a team that changes from a cautious 4-5-1 to a more attacking 4-3-3 may begin to produce more dangerous attacks and shots on target. This could indicate increased pressure, but it may also leave space behind the full-backs for counter-attacks. Similarly, a team that introduces a defensive midfielder while protecting a lead may accept less possession in exchange for a more compact shape.
Timing is important. A change made shortly before a goal, red card or injury may not immediately appear in the statistics. The observer should allow a short period for the new structure to settle and then check whether field position, attacking entries and chance quality have changed. A rise in possession alone is less convincing than a rise accompanied by more penalty-area touches or big chances.
Cards and fatigue can also alter the interpretation. A booked defender may avoid aggressive challenges, while tired players may create more gaps late in the match. These factors can make a previously balanced game more open, particularly when both teams still need a result.
Match the Statistical Pattern to the Market
The same live evidence can have different implications depending on the market. For a match-result assessment, the main question is whether one team is controlling the game strongly enough to overcome the current scoreline and the remaining time. A team dominating possession, territory, shots on target and big chances may look more threatening than the scoreboard suggests, but the price must still reflect the limited time available.
For total-goals markets, the focus is on the quality and frequency of opportunities still likely to arrive. A high number of dangerous attacks is not sufficient if most attacks end with blocked crosses or distant shots. A more persuasive case for further goals may include both teams reaching the final third, recent shots on target, defensive errors and an increasingly open midfield.
BTTS requires a different balance. One team’s dominance can support a home or away win, but it does not automatically suggest that both teams will score. To assess BTTS, look for evidence that each side can create danger. This might include shots on target from both teams, effective counter-attacks by the less dominant side or defensive weaknesses exposed when possession changes.
If only one team is creating chances and the other has recorded little attacking activity, a strong favourite may be more relevant than BTTS. Conversely, an even match with big chances at both ends may support a goals-based interpretation, even when the possession figures are close.
Compare Momentum with Price and Remaining Time
A statistical advantage is not the same as betting value. Before considering a market, compare the live pattern with the odds, the scoreline and the minutes remaining. A dominant team may already be heavily favoured, meaning that the available price leaves little margin for uncertainty.
It is also useful to record whether the pressure is sustained or merely a short sequence following a corner, substitution or goal. Rechecking the figures after several minutes can reduce the risk of reacting to an isolated event. The strongest analysis combines repeated evidence with a clear explanation of how the teams are likely to behave next.
Make Decisions with Discipline
Live football analysis is strongest when statistics are treated as connected signals rather than isolated answers. Possession, territory, shots on target, dangerous attacks and big chances can reveal how a match is developing, while tactical changes may explain why that pattern is shifting.
Even when the evidence appears convincing, uncertainty remains. Events such as a deflection, red card, injury or individual error can change the game quickly. A measured approach therefore means waiting for patterns to become clear, comparing them with the scoreline and remaining time, and assessing whether the available price reflects the risk.
The objective is not to force a selection in every match. It is to identify situations that are understandable, supported by several relevant indicators and appropriate for the market being considered. When the evidence is conflicting or the price offers little value, choosing not to act can be the most disciplined decision.